Statistics released today by the Canadian Real Estate Association (CREA) show national home sales set another all-time record in January 2021.
Summary:
- National home sales rose 2% on a month-over-month (m-o-m) basis in January.
- Actual (not seasonally adjusted) activity was up 35.2% year-over-year (y-o-y).
- The number of newly listed properties dropped by 13.3% from December 2020 to January 2021.
- The MLS® Home Price Index (HPI) rose 1.9% m-o-m and was up 13.5% y-o-y.
- The actual (not seasonally adjusted) national average sale price posted a 22.8% y-o-y gain in January.
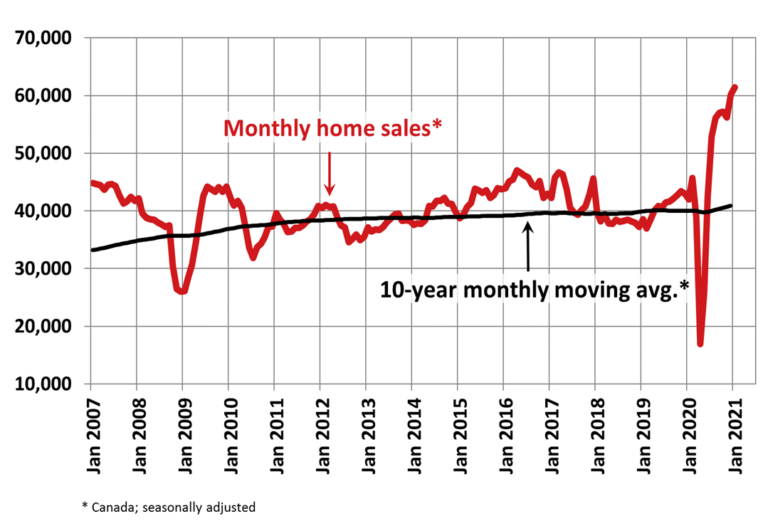
Home sales recorded over Canadian MLS® Systems climbed 2% between December 2020 and January 2021 to set another new all-time record.
Seasonally adjusted activity was running at an annualized pace of 736,452 units in January, significantly above CREA’s current 2021 forecast for 583,635 home sales this year. Sales will be hard pressed to maintain current activity levels in the busier months to come absent a surge of much-needed new supply; although, that could materialize as current COVID-19 restrictions are increasingly eased and the weather starts to improve.
The month-over-month increase in national sales activity from December to January was led by a mixed bag of gains under the surface, including in Edmonton, the Greater Toronto Area (GTA), Chilliwack B.C., Calgary, Montreal and Winnipeg. There was more of a pattern to the declines in January. Many of those were in Ontario markets, following predictions that sales in that part of the country might dip to start the year with so little inventory currently available and many of this year’s sellers likely to remain on the sidelines until spring.
Actual (not seasonally adjusted) sales activity posted a 35.2% y-o-y gain in January. In line with activity since last summer, it was a new record for the month of January by a considerable margin. For the seventh straight month, sales activity was up in almost all Canadian housing markets compared to the same month the previous year. Among the 11 markets that posted year-over-year sales declines, nine were in Ontario where supply is extremely limited at the moment.
“2021 started off just like 2020 ended, with a number of key housing market indicators continuing to set records,” stated Costa Poulopoulos, Chair of CREA. “The two big challenges facing housing markets this year are the same ones we were facing last year – COVID and a lack of supply. It’s looking like our collective efforts to bring those COVID cases down over the last month and a half are working. With luck, some potential sellers who balked at wading into the market last year will feel more comfortable listing this year. As lockdowns are once again easing and the spring market begins to ramp up, we will remain vigilant in adhering to all the latest government and health officials’ directives to keep our clients safe. Now as always, REALTORS® remain the best source for information and guidance when negotiating the sale or purchase of a home,” continued Poulopoulos.
“The problem with this time of year is that the buyers and sellers that will in time define the Canadian housing story of 2021 are mostly all still waiting in the wings,” said Shaun Cathcart, CREA’s Senior Economist. “It’s the dead of winter and we’re only just starting to get the second wave of COVID under control. We’re unlikely to see a rush of listings until the weather and public heath situations improve, and we won’t see buyers until those homes come up for sale.
The best case scenario would be if we see a lot of sellers who were gun-shy to engage in the market last year making a move this year. A big surge in supply is what so many markets really need this year to get people into the homes they want, and to keep prices from accelerating any more than they already are.”
The number of newly listed homes dropped by 13.3% in January, led by double-digit declines in the GTA, Hamilton-Burlington, London and St. Thomas, Ottawa, Montreal, Quebec and Halifax Dartmouth.
With sales edging higher and new supply falling considerably in January, the national sales-to-new listings ratio tightened to 90.7% – the highest level on record for the measure by a significant margin. The previous monthly record was 81.5% set 19 years ago. The long-term average for the national sales-to-new listings ratio is 54.3%.
Based on a comparison of sales-to-new listings ratio with long-term averages, only about 20% of all local markets were in balanced market territory in January, measured as being within one standard deviation of their long-term average. The other 80% of markets were above long-term norms, in many cases well above. This was a record for the number of markets in seller’s market territory.
The number of months of inventory is another important measure of the balance between sales and the supply of listings. It represents how long it would take to liquidate current inventories at the current rate of sales activity.
There were only 1.9 months of inventory on a national basis at the end of January 2021 – the lowest reading on record for this measure. At the local market level, some 35 Ontario markets were under one month of inventory at the end of January.
The Aggregate Composite MLS® Home Price Index (MLS® HPI) rose by 1.9% m-o-m in January 2021. Of the 40 markets now tracked by the index, prices were up on a m-o-m basis in 36.

The non-seasonally adjusted Aggregate Composite MLS® HPI was up 13.5% on a y-o-y basis in January – the biggest gain since June 2017.
The largest y-o-y gains – above 30% – were recorded in the Lakelands region of Ontario cottage country, Northumberland Hills, Quinte & District, Tillsonburg District and Woodstock-Ingersoll.
Y-o-y price increases in the 25-30% range were seen in Barrie, Niagara, Grey-Bruce Owen Sound, Huron Perth, Kawartha Lakes, London & St. Thomas, North Bay, Simcoe & District and Southern Georgian Bay.
This was followed by y-o-y price gains in the range of 20-25% in Hamilton, Guelph, Oakville-Milton, Bancroft and Area, Brantford, Cambridge, Kitchener-Waterloo, Peterborough and the Kawarthas, Ottawa and Greater Moncton.
Prices were up 16.6% compared to last January in Montreal. Meanwhile, y-o-y price gains were in the 10-15% range on Vancouver Island, Chilliwack, the Okanagan Valley, Winnipeg, the GTA and Mississauga. Prices rose in the 5-10% range in Victoria, Greater Vancouver, Regina and Saskatoon. Home prices were up 2% and 2.2% in Calgary and Edmonton, respectively.
The MLS® HPI provides the best way to gauge price trends because averages are strongly distorted by changes in the mix of sales activity from one month to the next.
The actual (not seasonally adjusted) national average home price was a record $621,525 in January 2021, up 22.8% from the same month last year.
The national average price is heavily influenced by sales in Greater Vancouver and the GTA, two of Canada’s most active and expensive housing markets. Excluding these two markets from calculations cuts $129,000 from the national average price.
Provided by: CREA


