Statistics released today by the Canadian Real Estate Association (CREA) show national home sales continued running at historically strong levels in October 2020.
Summary:
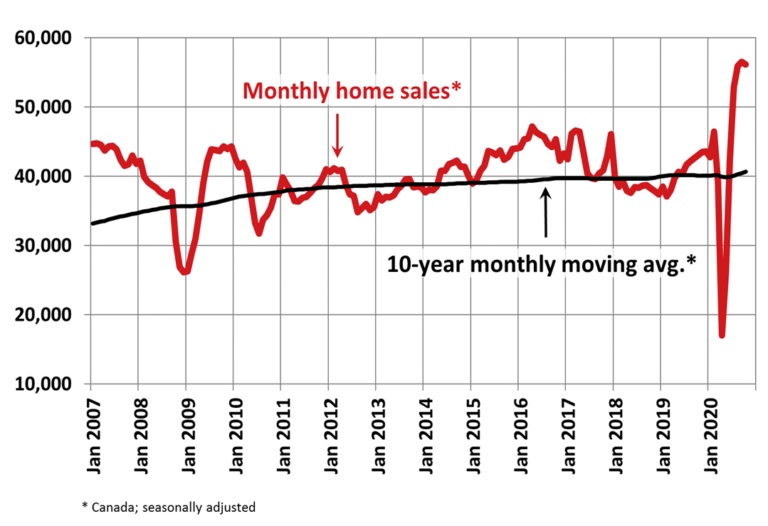
- National home sales edged back 0.7% on a month-over-month (m-o-m) basis in October.
- Actual (not seasonally adjusted) activity was up 32.1% year-over-year (y-o-y).
- The number of newly listed properties rose 2.9% from September to October.
- The MLS® Home Price Index (HPI) rose 1% m-o-m and was up 10.9% y-o-y.
- The actual (not seasonally adjusted) national average sale price posted a 15.2% y-o-y gain in October.
Home sales recorded over Canadian MLS® Systems in October 2020 edged back by 0.7% from September’s all-time record for monthly sales.
The small change from September to October reflected gains in about half of all local markets offset by declines in the other half. Among the larger markets, activity was up on the month in Montreal, the Fraser Valley, Calgary and Edmonton. By contrast, sales fell back in Greater Toronto Area (GTA), Hamilton-Burlington, Ottawa and Greater Vancouver.
Actual (not seasonally adjusted) sales activity posted a 32.1% y-o-y gain in October. It was a new record for that month by a margin of more than 14,000 transactions. For the fourth straight month, sales activity was up in almost all Canadian housing markets compared to the same month in 2019. Among the few markets that were down on a year-over-year basis, it is possible the handful that are in Ontario simply do not have the supply at the moment.
So far this year, some 461,818 homes have traded hands over Canadian MLS® Systems, up 8.6% from the first 10 months of 2019. In fact, it was the second-highest January-October sales figure on record, trailing only 2016.
“Many Canadian housing markets continue to see historically strong levels of activity, and at this point over and above what would have been required to make up for the very quiet spring market this year,” stated Costa Poulopoulos, Chair of CREA. “As you may have heard, as of October 19 CREA is once again recommending against in-person open houses. We’ll have to wait and see how a return to more restrictive safety measures impacts housing markets as we move towards the end of this strange year, particularly if it leads to fewer people putting their homes up for sale in regions that already have historic supply shortages. In the meantime, we will remain vigilant in adhering to government and health officials’ directives to keep our clients safe, including the use of all the virtual technology solutions that were so popular back in the spring. Now as always, REALTORS® remain the best source for information and guidance when negotiating the sale or purchase of a home,” continued Poulopoulos.
“For anyone waiting for the Canadian existing home market to begin to settle down following this summer’s surprisingly strong recovery, they’re going to have to wait a little longer. It was evident that the same trends we’ve been seeing since July – record sales and record prices amid tight overall supply – was once again the story in October,” said Shaun Cathcart, CREA’s Senior Economist. “As we’ve moved through the last few months of headline-grabbing data, we’ve seen sales activity for the year-to-date not just catch up with last year, which was surprising enough, but at this point activity in 2020 has a real shot at setting an annual record. Many reasons have been suggested for why this is when many traditional drivers of the market, economic growth, employment and confidence in particular, are currently so weak. Something worth considering is how many households are choosing to pull up stakes and move as a result of COVID-19 and all the associated changes to our lives. We could be seeing a lot of moves, or churn in the market, that would not have happened in a non-COVID world.”
The number of newly listed homes climbed 2.9% in October. The overall gain in new supply in October was driven by more new listings in the GTA, B.C.’s Lower Mainland and Ottawa. As with sales activity, actual (not seasonally adjusted) new listings set a new record for the month of October; however, it was by far less of a margin than sales, meaning market conditions are still very tight in many parts of the country.
With new supply up in October and sales relatively little changed, the national sales-to-new listings ratio eased to 74.3% — still among the highest levels on record for the measure. The long-term average for the national sales-to-new listings ratio is 54.1%.
Based on a comparison of sales-to-new listings ratio with long-term averages, about a third of all local markets were in balanced market territory in October, measured as being within one standard deviation of their long-term average. The other two-thirds of markets were above long-term norms, in many cases well above.
The number of months of inventory is another important measure of the balance between sales and the supply of listings. It represents how long it would take to liquidate current inventories at the current rate of sales activity.
There were just 2.5 months of inventory on a national basis at the end of October 2020 – the lowest reading on record for this measure. At the local market level, some 18 Ontario markets were under one month of inventory at the end of October.
The Aggregate Composite MLS® Home Price Index (MLS® HPI) rose by 1% m-o-m in October 2020. Of the 39 markets now tracked by the index, all but one were up between September and October.

The non-seasonally adjusted Aggregate Composite MLS® HPI was up 10.9% on a y-o-y basis in October – the biggest gain since July 2017.
The largest y-o-y gains – more than 25% – were recorded in Quinte & District and Woodstock-Ingersoll.
Y-o-y price increases in the 20-25% range were seen in Ottawa, London & St. Thomas, Tillsonburg District and a number of Ontario cottage country areas.
This was followed by y-o-y price gains in the range of 15-20% in Barrie, Hamilton, Niagara, Guelph, Bancroft and Area, Brantford, Cambridge, Huron Perth, Kitchener-Waterloo, North Bay, Peterborough and the Kawarthas, Simcoe & District, Montreal and Greater Moncton.
Prices were up in the 10-15% range compared to last October in the GTA, Oakville-Milton, Mississauga and Northumberland Hills.
Meanwhile, y-o-y price gains were in the 5-10% range in Greater Vancouver, the Fraser Valley, the Okanagan Valley, Regina, Saskatoon, Winnipeg and Quebec City. Gains were less than 4% in Victoria and elsewhere on Vancouver Island, as well as in St. John’s, and prices were just inside positive territory y-o-y in Calgary and Edmonton.
The MLS® HPI provides the best way to gauge price trends because averages are strongly distorted by changes in the mix of sales activity from one month to the next.
The actual (not seasonally adjusted) national average home price set another record in October 2020, coming in at $607,250. This was up 15.2% from the same month last year.
The national average price is heavily influenced by sales in Greater Vancouver and the GTA, two of Canada’s most active and expensive housing markets. Excluding these two markets from calculations cuts more than $127,000 from the national average price.
Provided by: CREA